Getting Started
Installation
Download the latest version of Elegans from here. Then copy and paste code below to your html file.
<script type="text/javascript" src="http://cdnjs.cloudflare.com/ajax/libs/three.js/r66/three.min.js"></script>
<script type="text/javascript" src="http://cdnjs.cloudflare.com/ajax/libs/d3/3.4.4/d3.min.js"></script>
<script type="text/javascript" src="your_link_to_elegans.min.js"></script>
Preparing Data
There are two input formats of vertexes, Matrix and Array.
Matrix
Matrix format is looks like return value of Numpy.meshgrid. Surface and Wireframe support this format.
var data =
{x:[
[1,1,1],
[2,2,2],
[3,3,3]
],
y:[
[1,2,3],
[1,2,3],
[1,2,3]
],
z:[
[1,2,3],
[4,5,6],
[7,8,9]
]};
Array
In Array format, the set of 3 values that have the same index in x,y,z array indicates 1 vertex. Line, Particles and Scatter support this format.
var data = {x:[1,2,3],y:[1,2,3],z:[1,2,3]};
Quick plotting
You can quickly generate plots in method-chain style, with d3.js selector.
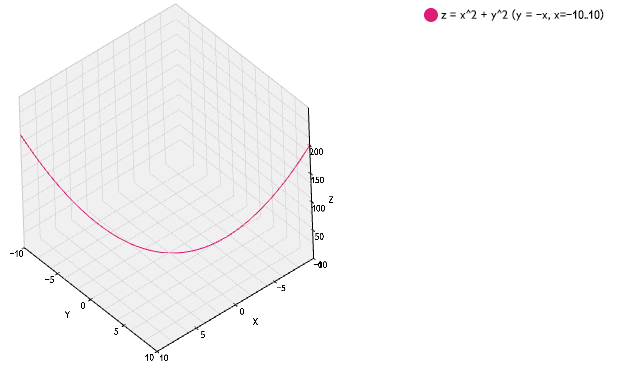
d3.select("#vis").datum(data).call(Elegans.LinePlot.thickness(5).colors(["#dd1c77","#dd1c77"]));
Multiple plotting
When you need to put multiple plots in one 3-dimentional space, you can write code like below.
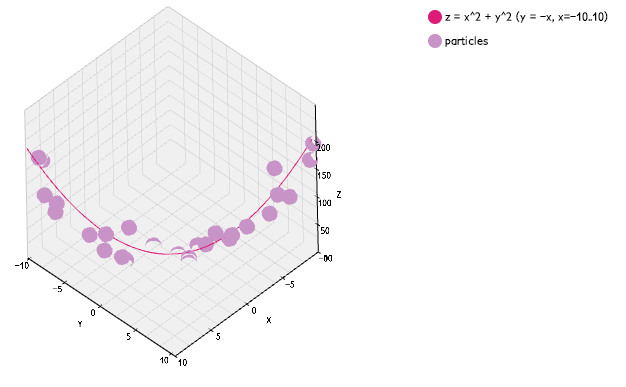
var stage = new Elegans.Stage(d3.select("#vis")[0][0]);
var line = new Elegans.Line(line_data, {thickness: 5, colors: ["#dd1c77","#dd1c77"]});
var particles = new Elegans.Particles(particles_data, {size: 0.8, color: "#c994c7"});
stage.add(line);
stage.add(particles);
stage.render();
Embedding Elegans into your library
Elegans has API to make it easier to embed it into various environments except browsers, like IPython notebook. What you need to do is only to generate simple JSON object, and embed it into static html templates like below.
var model = {
charts:[{type:"Particles",data:{x:[1,2,3],y:[1,2,3],z:[1,2,3]},options:{color:"#000000"}}],
options:{width:500, height:500}
};
Elegans.Embed.parse(model, "#vis");